On this webpage, I share some data visualizations on the socio-economic dimensions of women’s football (soccer).
Salary
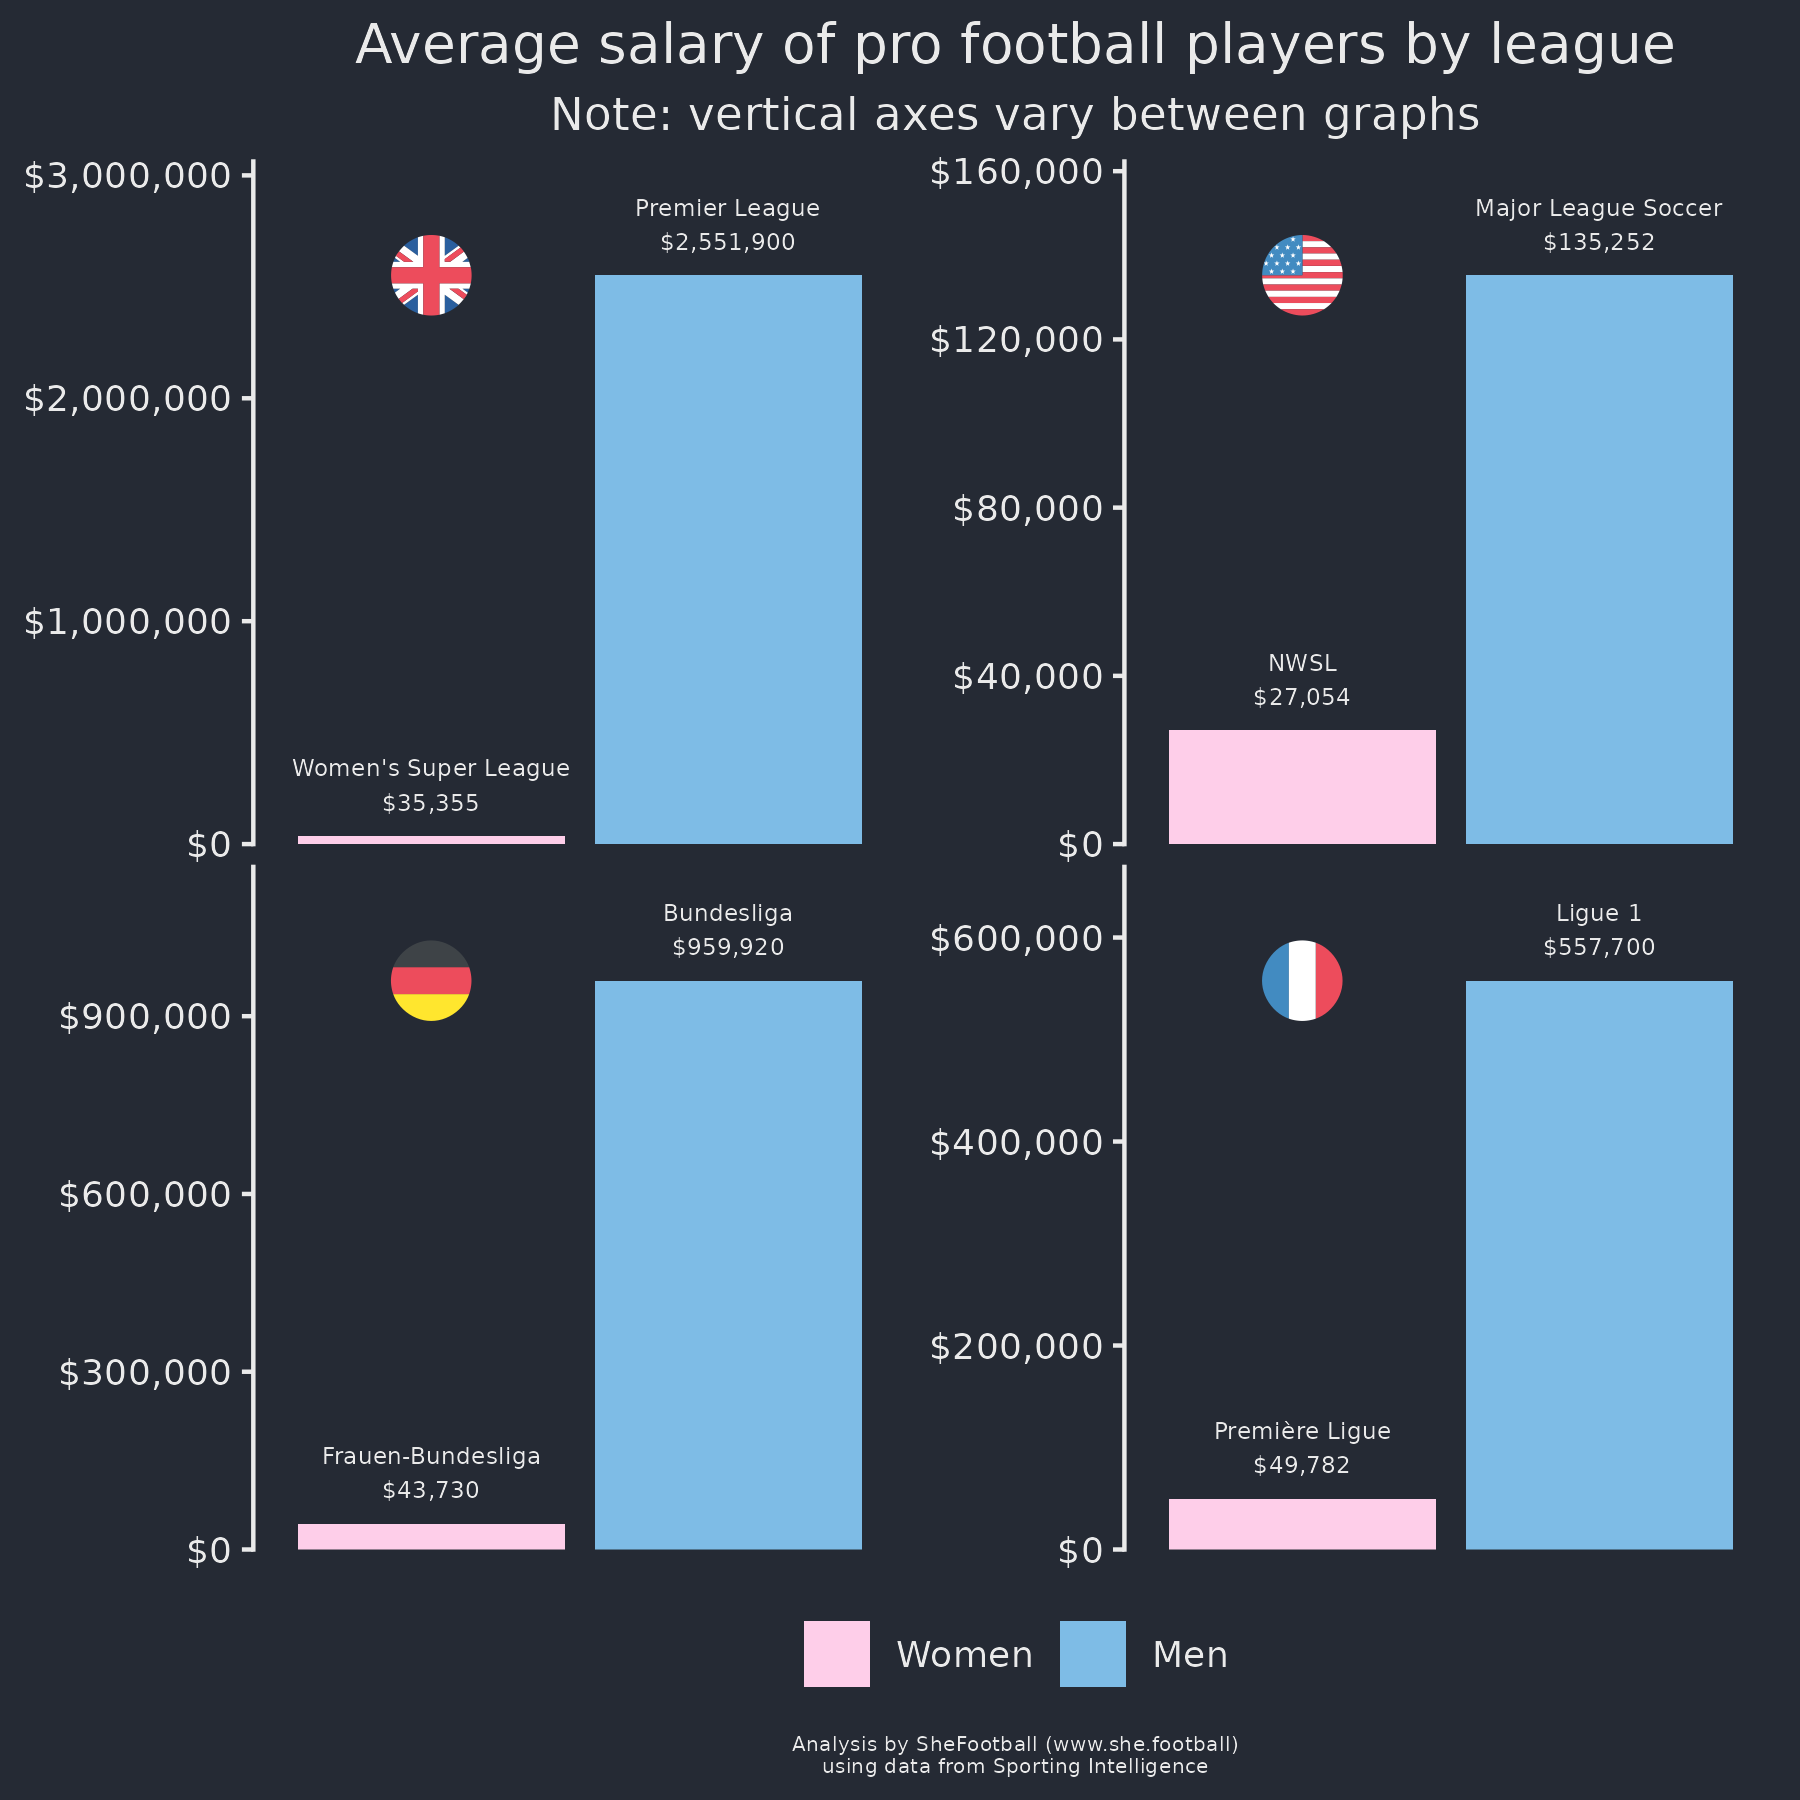
There is an excellent quote from Sporting Intelligence, in the context of Australian rules football (AFL and AFLW): “if the men took a 1 per cent pay cut, it would cover a 100 per cent pay rise for the women.”
It would take a little bit more than 1 per cent for women’s soccer, but not that much more: 1.4% in England, 4.6% in Germany, and 8.9% in France. The United States is slightly more reasonable at 20%, perhaps because the United States has historically been a strong country for women’s sport (and women’s soccer) while being a weak country for soccer overall. But even the comparatively reasonable United States represents an 80% pay gap.
I’m reminded of the fact that Fiona Worts, star striker for Adelaide United in Australia’s A-League Women, worked at McDonald’s in 2022 to supplement her pay (ABC). Several A-League Women players left the sport simply because it didn’t make economic sense.
Note that this data is from 2017 and might be a little bit out of date — naturally, high-quality data on people’s salaries is sensitive and hard to obtain. On the other hand, a 2024 survey by FIFA reported that a mean salary of 24,030 USD for women players in “Tier 1” leagues, which is comparable to the values used in this graph. That same FIFA survey found that salaries for players in lower-tier leagues drop off very quickly to 4,361 USD (Tier 2) and 2,805 (Tier 3) — in US dollars per year!
Attendance
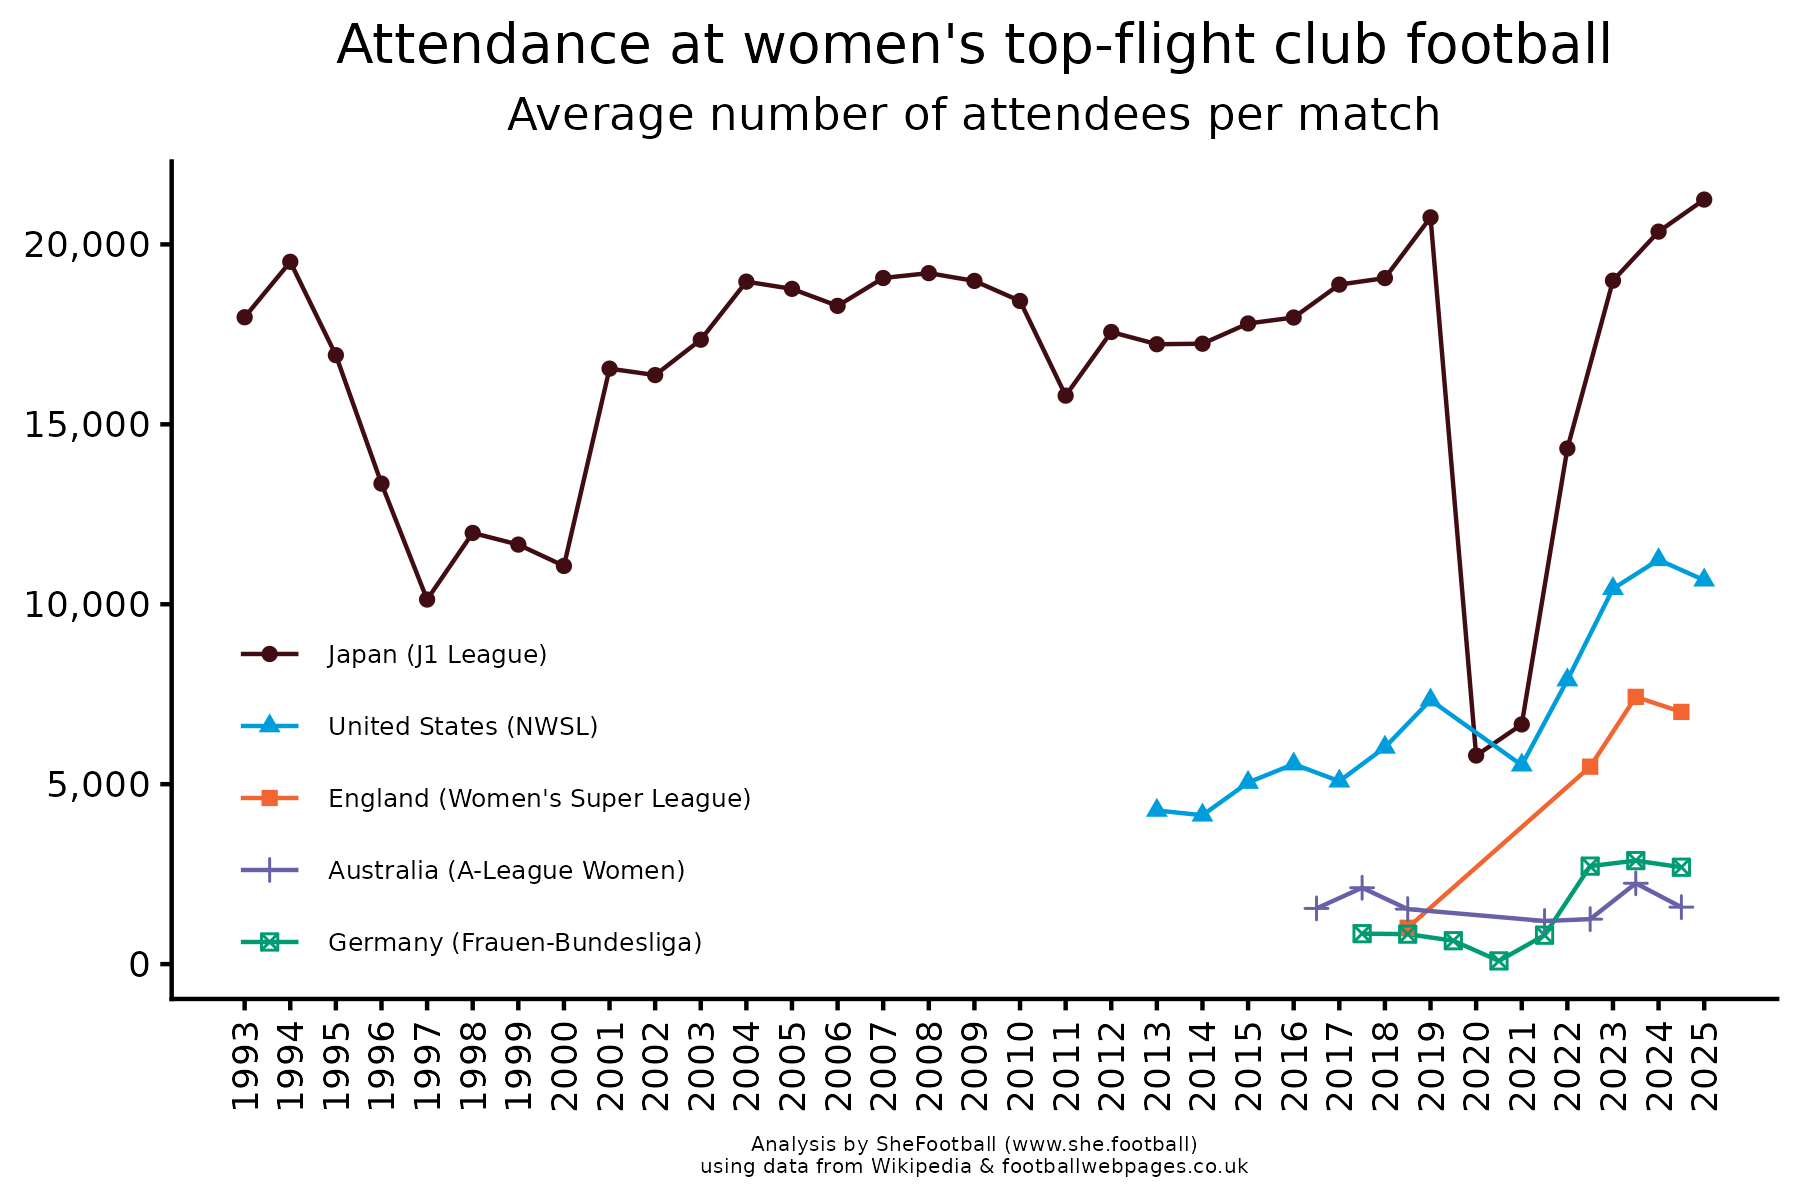
There has been a steady increase in the number of fans attending top-flight women’s club football matches in England, the United States, and Germany. Australia is lagging, despite having hosted the 2023 World Cup to great success and fanfare. All countries took a temporary hit around 2020 due to the pandemic.
ACL injuries
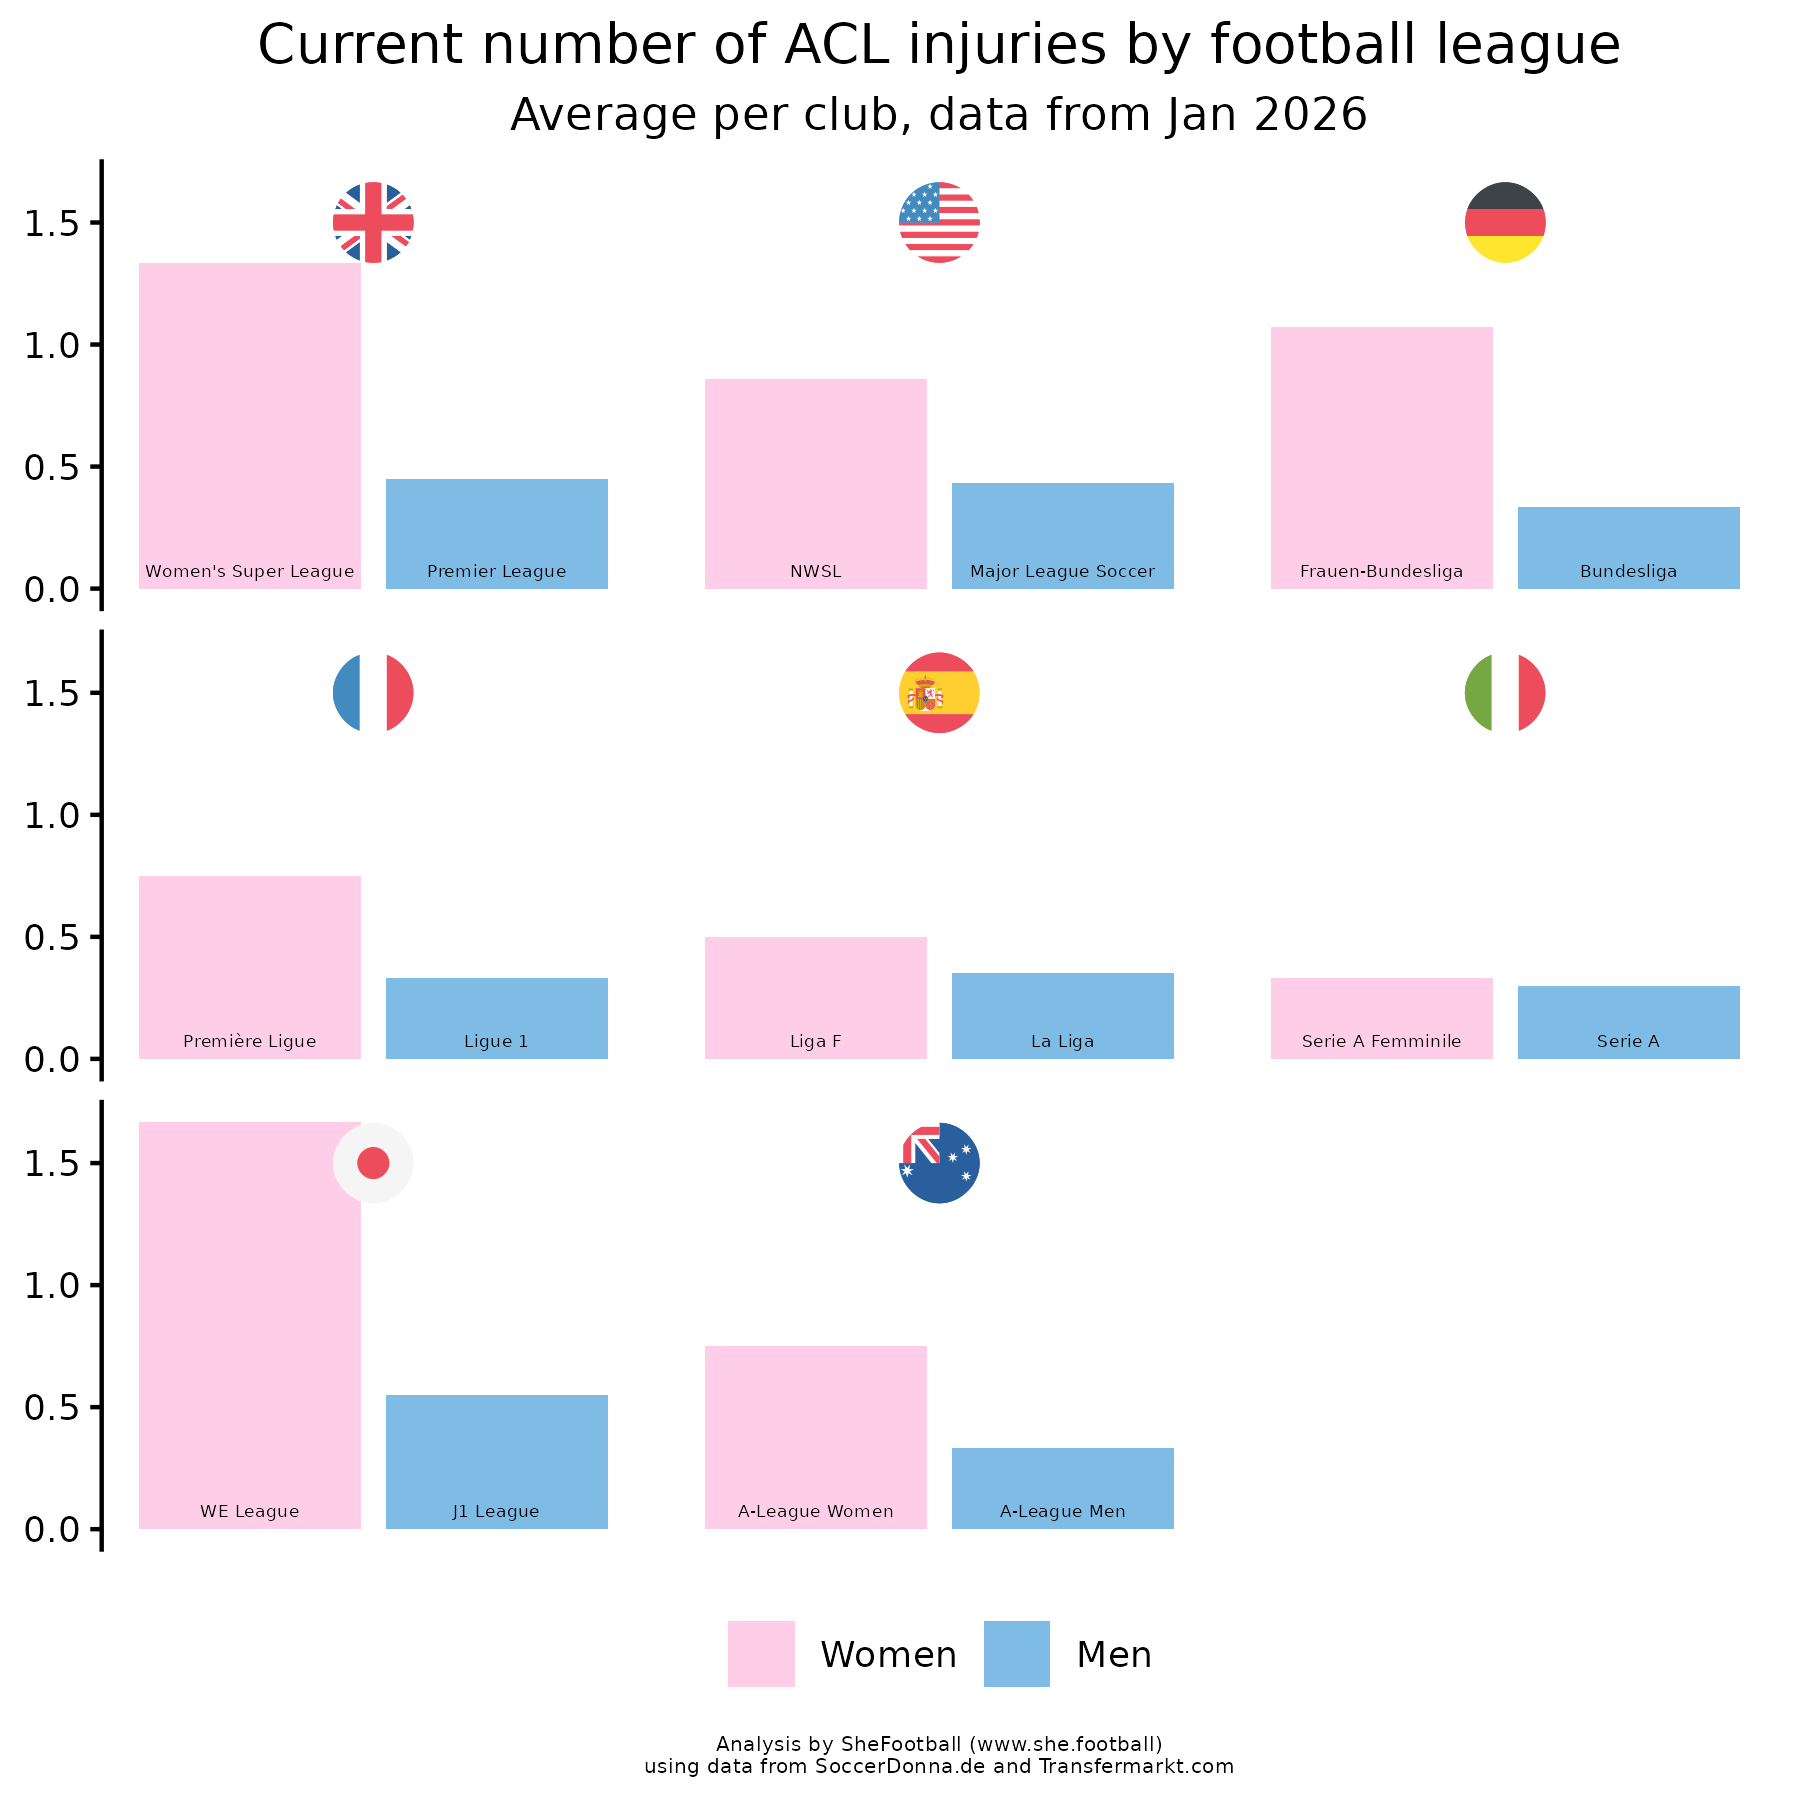
Anterior cruciate ligament (ACL) injuries are a type of serious knee injury that affect women footballers around 2.5 times as frequently as men (Bloch et al 2025). Long recovery times means that players are often out for a year or longer (Abed et al 2023), and Sam Kerr’s ACL injury kept her out of the game for 20 months (Wikipedia).
The causes of the higher rate of ACL injuries in women are currently the topic of active debate, and it is likely that our understanding will evolve over the next few years as major sporting bodies conduct studies (BBC). Some key academic sources on this topic are summarized in my blog article here.
Barriers
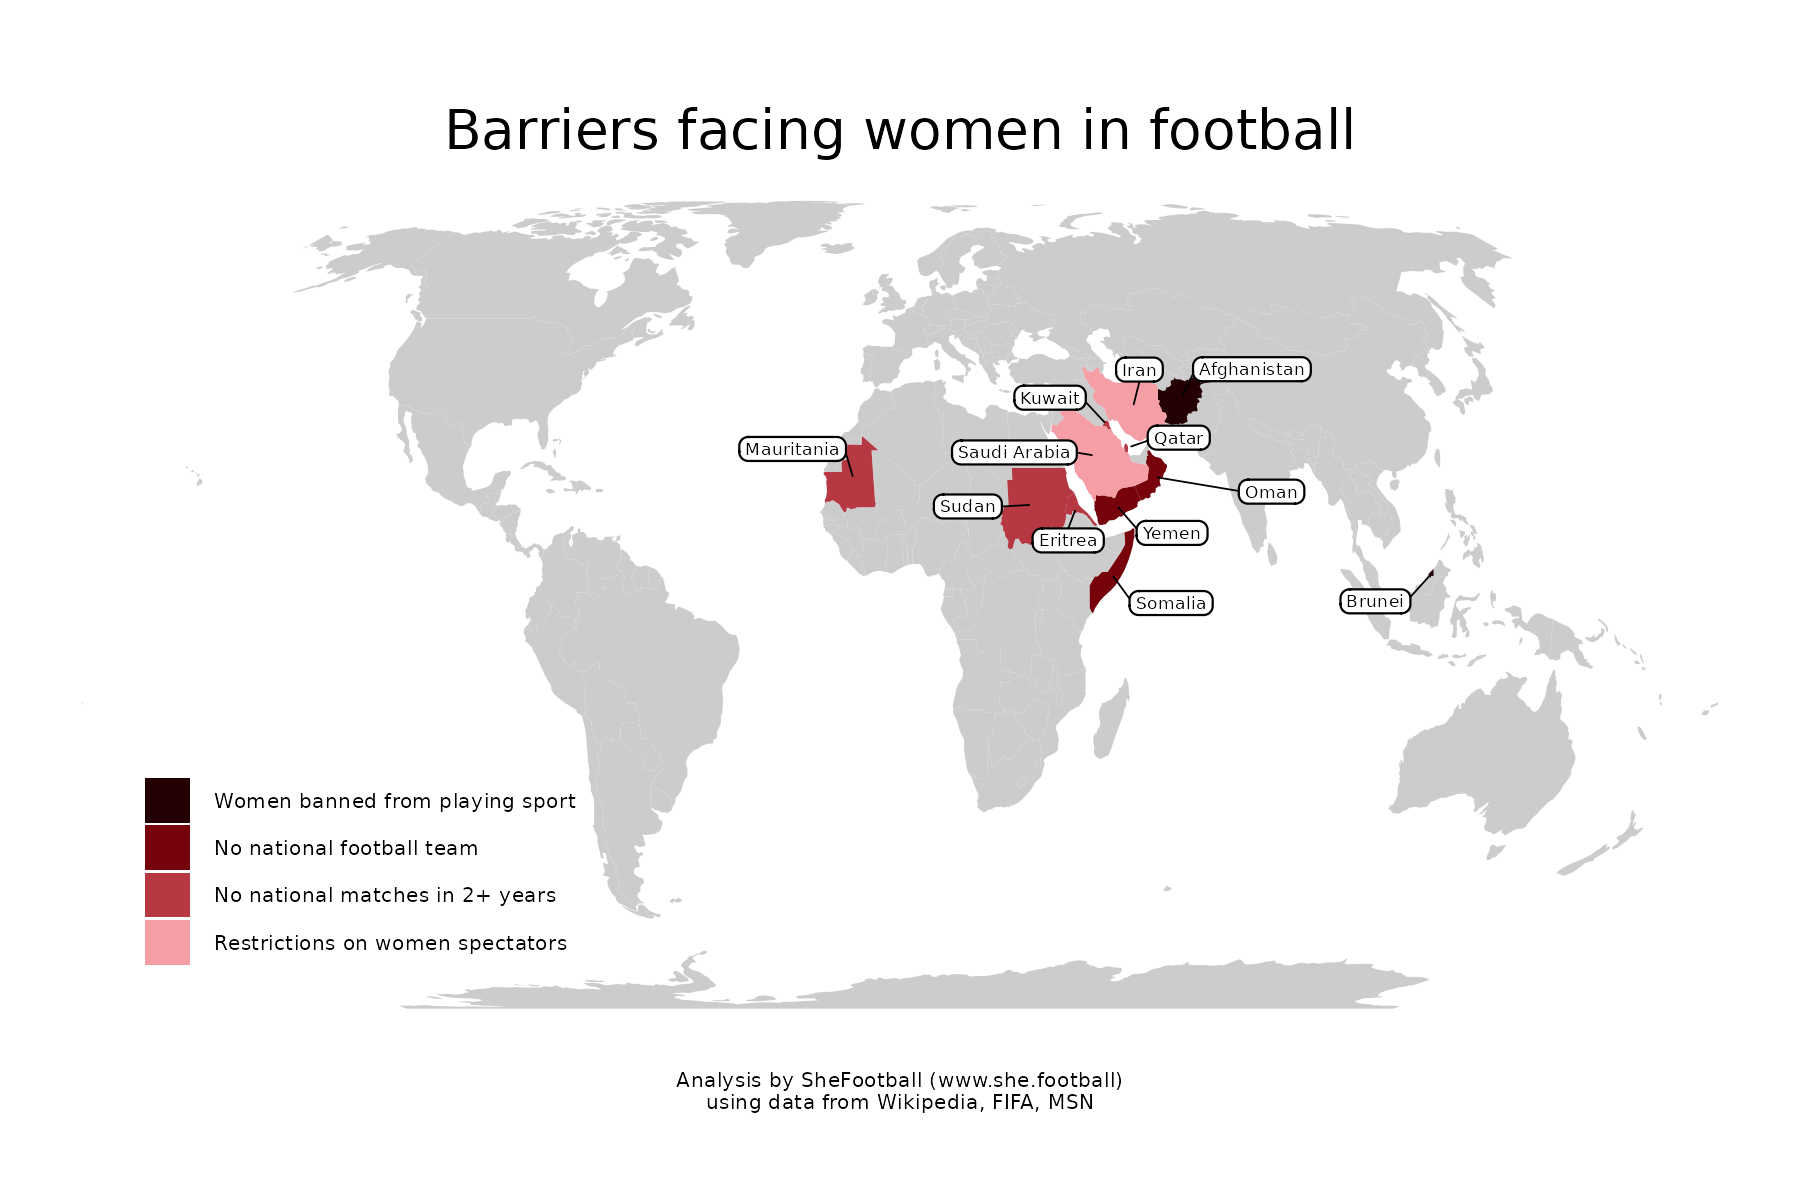
In several countries, there are major legal barriers preventing women from participating in football. Afghanistan has banned women from playing sport since the Taliban takeover in 2021, and football players were targeted for violence — many of Afghanistan’s international players were evacuated and settled in Australia (Wikipedia). Likewise, women’s football is banned in Brunei.
Recent news that Qatar was in talks with FIFA to host the first Women’s Club World Cup (The Guardian) were widely criticized because Qatar is not exactly a paragon of women’s football, women’s rights, or LGBT+ rights. Qatar’s national women’s football team has been inactive for over a decade, and being gay is punishable by death (Independent).
It is also worth noting that many European countries banned women from playing football during the 20th century. Notably, the FA’s 1921 ban on women playing football in England was only lifted in 1971 (Wikipedia), and even today the FA bans trans women from playing. This mean that I can play football in neither England nor Afghanistan — strange bedfellows indeed.
Analysis by SheFootball using data from Wikipedia, FIFA, and MSN
Football — the amateur sport
Most of the news coverage and published statistics — including this website — focuses on professional football. But in terms of participation numbers, football is overwhelmingly dominated by amateur football.
- England — 99.989% amateurs
- United States — 99.997% amateurs
- Australia — 99.984% amateurs
This means that professional players make up between 0.003 and 0.01 percent of players, depending on country. This is similar to your chance of dying of a bee sting (0.002%), being struck by lightning during your lifetime (0.007%), or getting a perfect score on the SAT (0.03%). Can you imagine if only people who have been struck by lightning could vote, or if the health department focused almost entirely on bee stings?
The following image illustrates this for Australia. Every grey pixel in the image represents an amateur player of women’s football in Australia. The tiny blue line at the bottom represents the vanishingly small number of professionals.

Australia also publishes data on the age of amateur players. The most common age group is age 25 to 34 with over a quarter of players, which surprised me. There are almost as many players aged 45 and over (12.5 %) as there are players aged 15 to 17 (14.6 %).
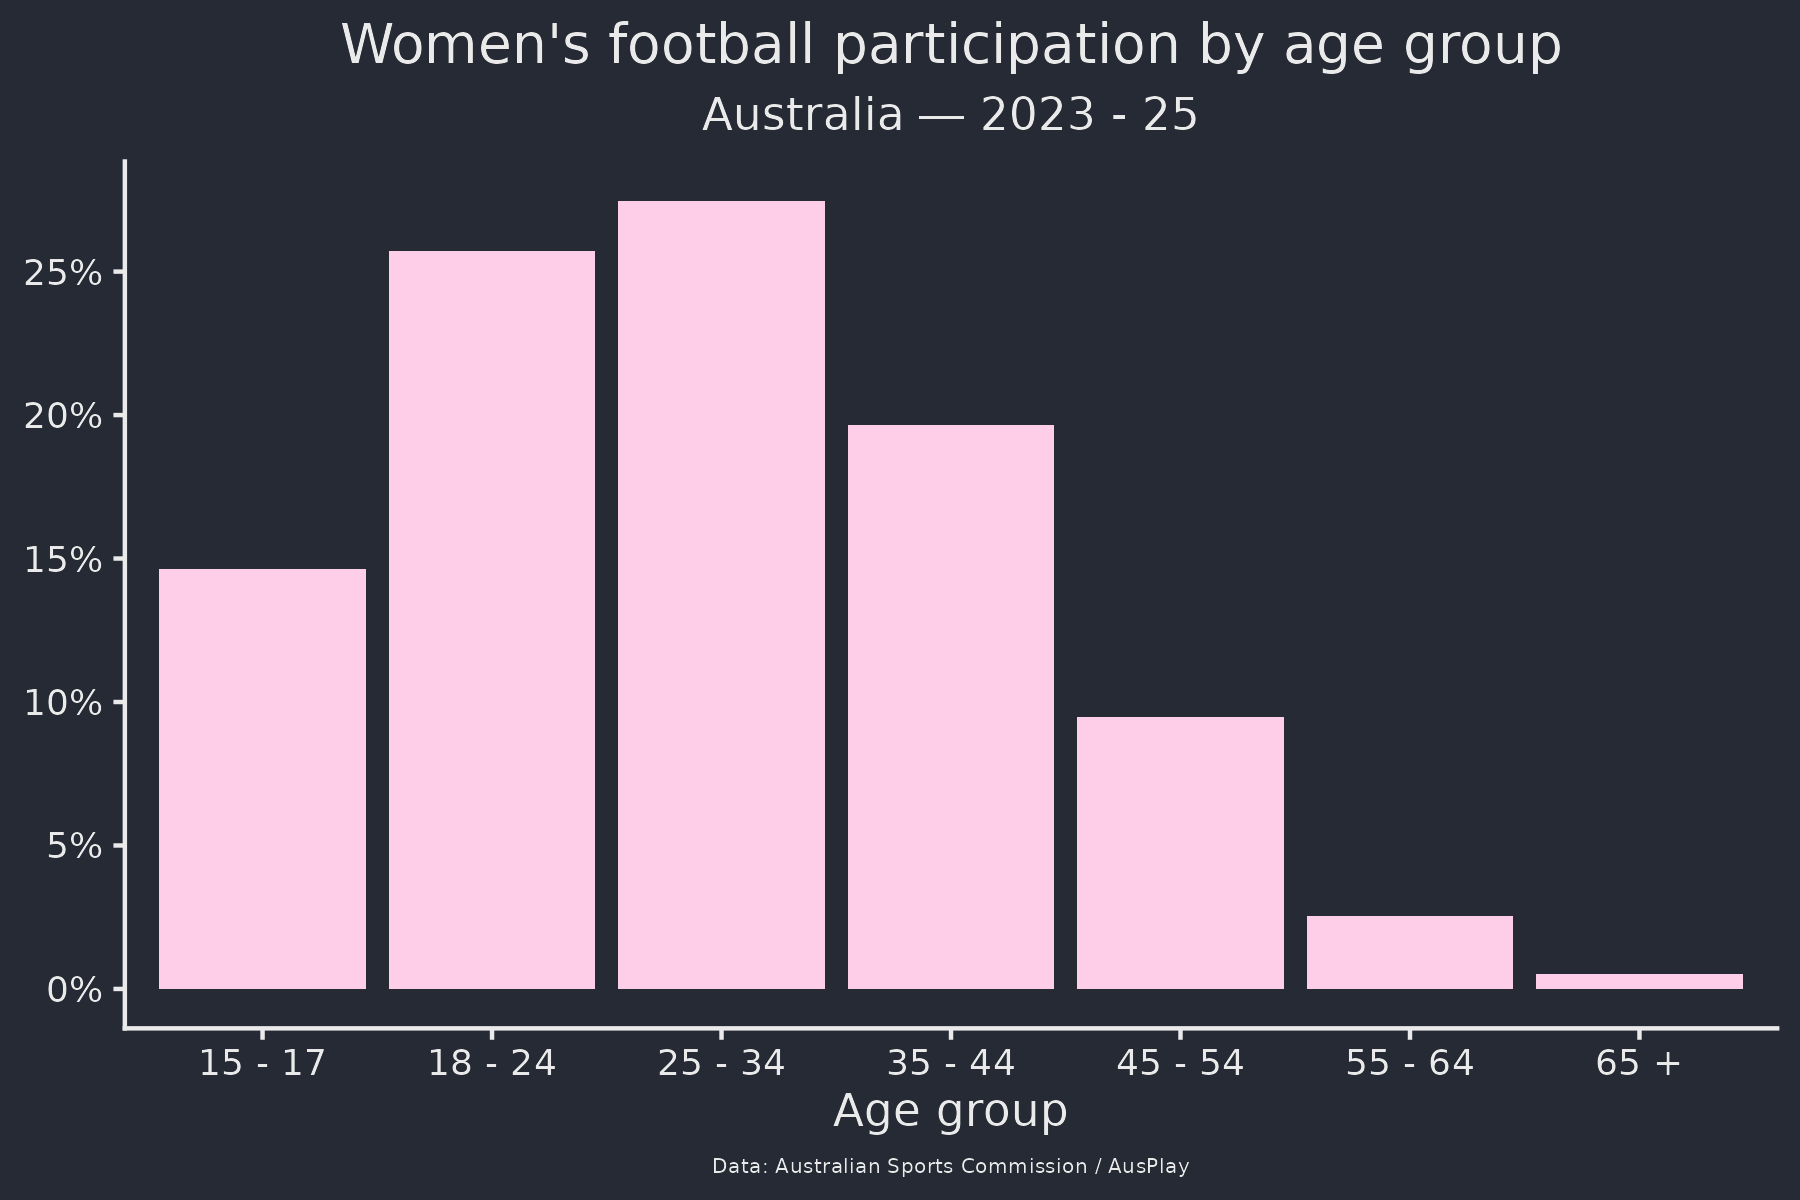
Policies aiming to exclude transgender players in England and the United States is usually grounded in discussions of the professional game rather than the amateur game. The diversity in age groups also raises the question of whether the “unfair advantage” discourse has any merit in a sport where teenagers play alongside players aged 50+ (my own team has both!).
We can also examine participation by ethnic and cultural background.
In European countries, there is an interesting phenomenon. We often observe that participation in sports is higher for males than females. But when we also include ethnic or migratory background, we see that females who recently immigrated have the lowest participation of all. In other words, there is an intersection between gender and ethnic/migratory background. This phenomenon is particularly relevant for policymakers, as membership in sports clubs is one way for immigrants to become involved in the mainstream society of the host country.
The following graphs illustrate this phenomenon for three European countries: Germany, Denmark, and England. Note that the German and Denmark graphs relate to all sports, not just football, due to limitations of the data.
- In Germany, we can see that female adolescents with a migratory background have the lowest participation among all adolescents.
- In Denmark, we can see that female adolescent students from the first generation of immigrants has the lowest participation of all adolescent students. Notably, immigrants of the second generation approach native Danes in their participation rates, indicating assimilation into the host culture.
- England is different. Here, we observe the opposite trend. Muslim adults have a higher rate of participation in football than all adults. Female Muslims participate in football at about half the frequency of all males. The data for England includes non-binary adults, who participate in football at a rate between that for female and male adults, though there is no data for Muslim non-binary adults.
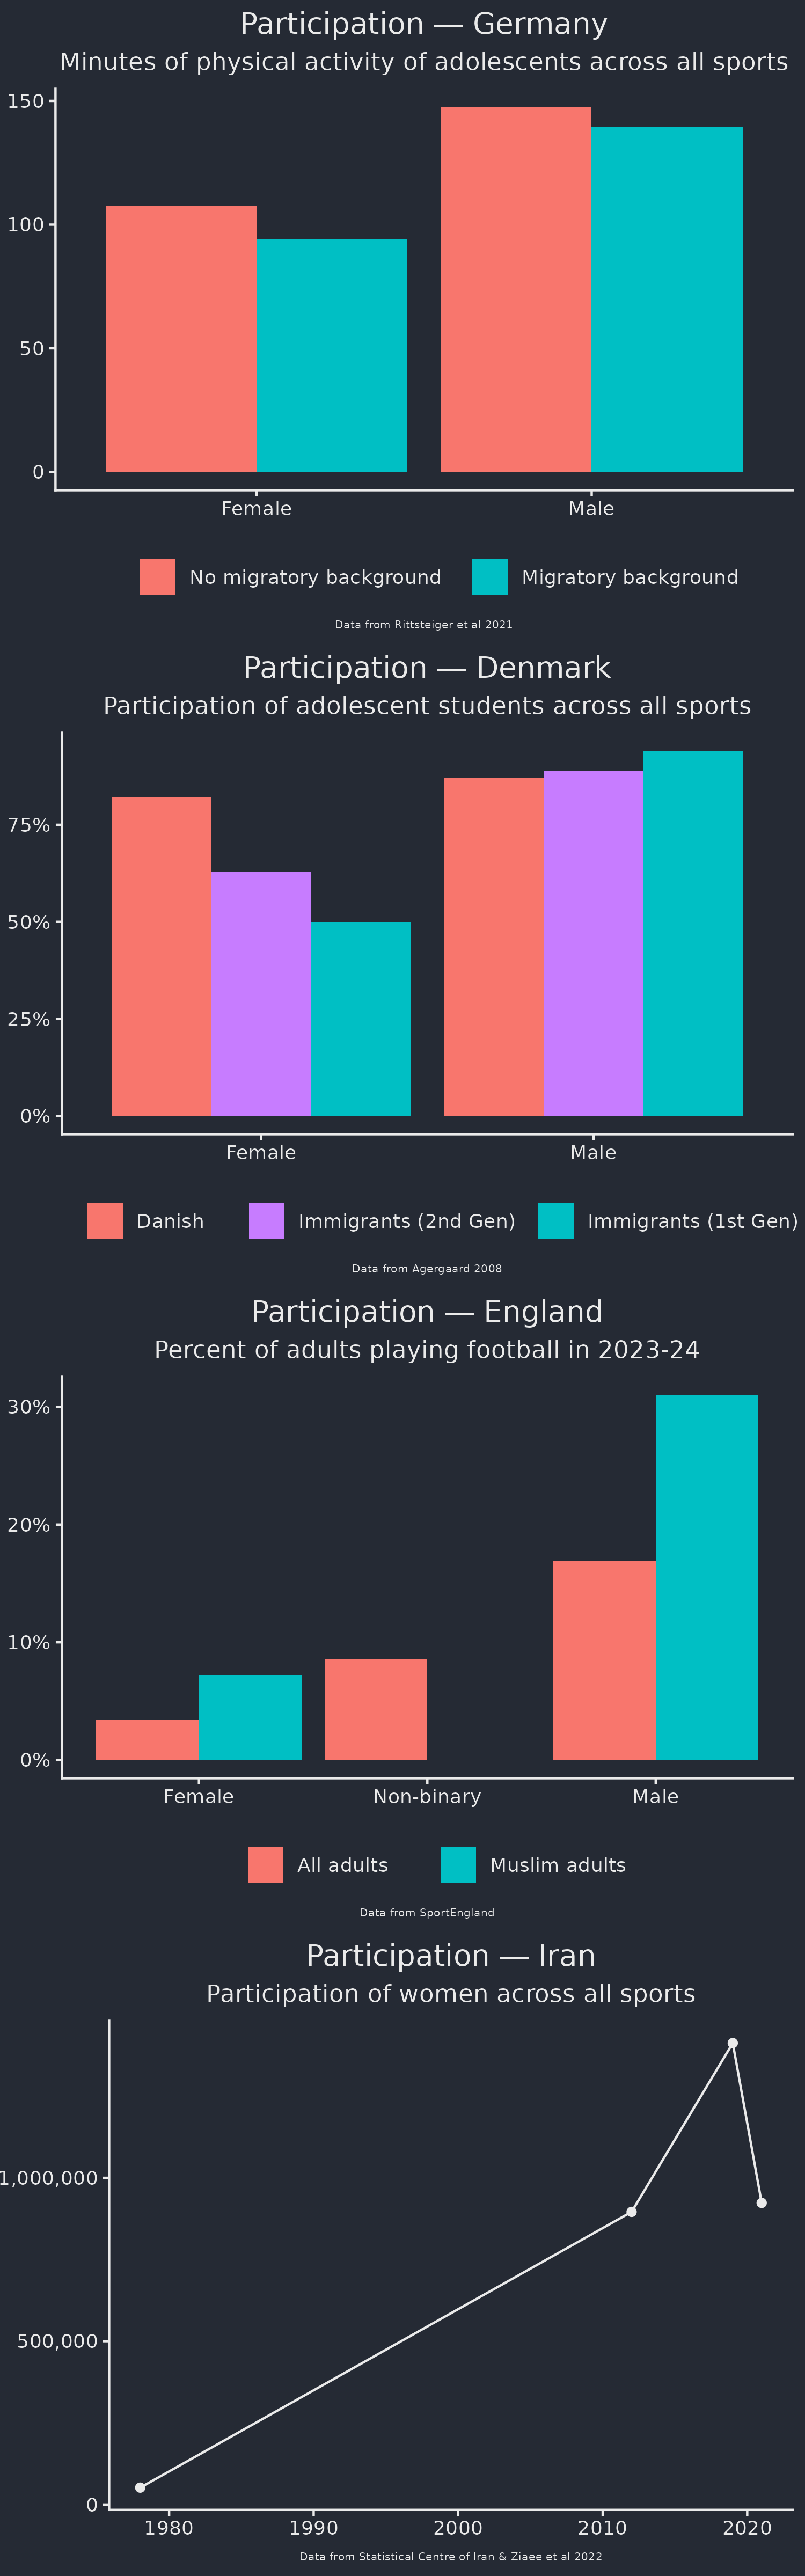
I don’t know what explains the difference between Germany and Denmark on one hand and England on the other, but it’s certainly interesting. Is this specific to England, or something about football in particular? Are there any lessons that can be learned to help immigrants assimilate in other countries?
Those three graphs examine immigrants and Muslims in countries where they form a minority group. The final graph examines Muslims in a Muslim-majority country.
The participation of women across all sports in the Islamic Republic of Iran, a Muslim-majority country, has increased substantially. This is likely due to government policies that have actively sought to expand the availability of women-only sporting spaces, allowing women to participate in sport while preserving their religious commitments.
Both of these topics (sport participation among immigrant and religious minority women in Europe, and participation among women in Muslim-majority countries) are explored in-depth in the book Muslim Women and Sport (eds. Tansin Benn, Gertrud Pfister & Haifaa Jawad, 2010).
Physical ability and game position
Finally, as a keeper, I feel obligated to put a graph in here about goalkeeping.
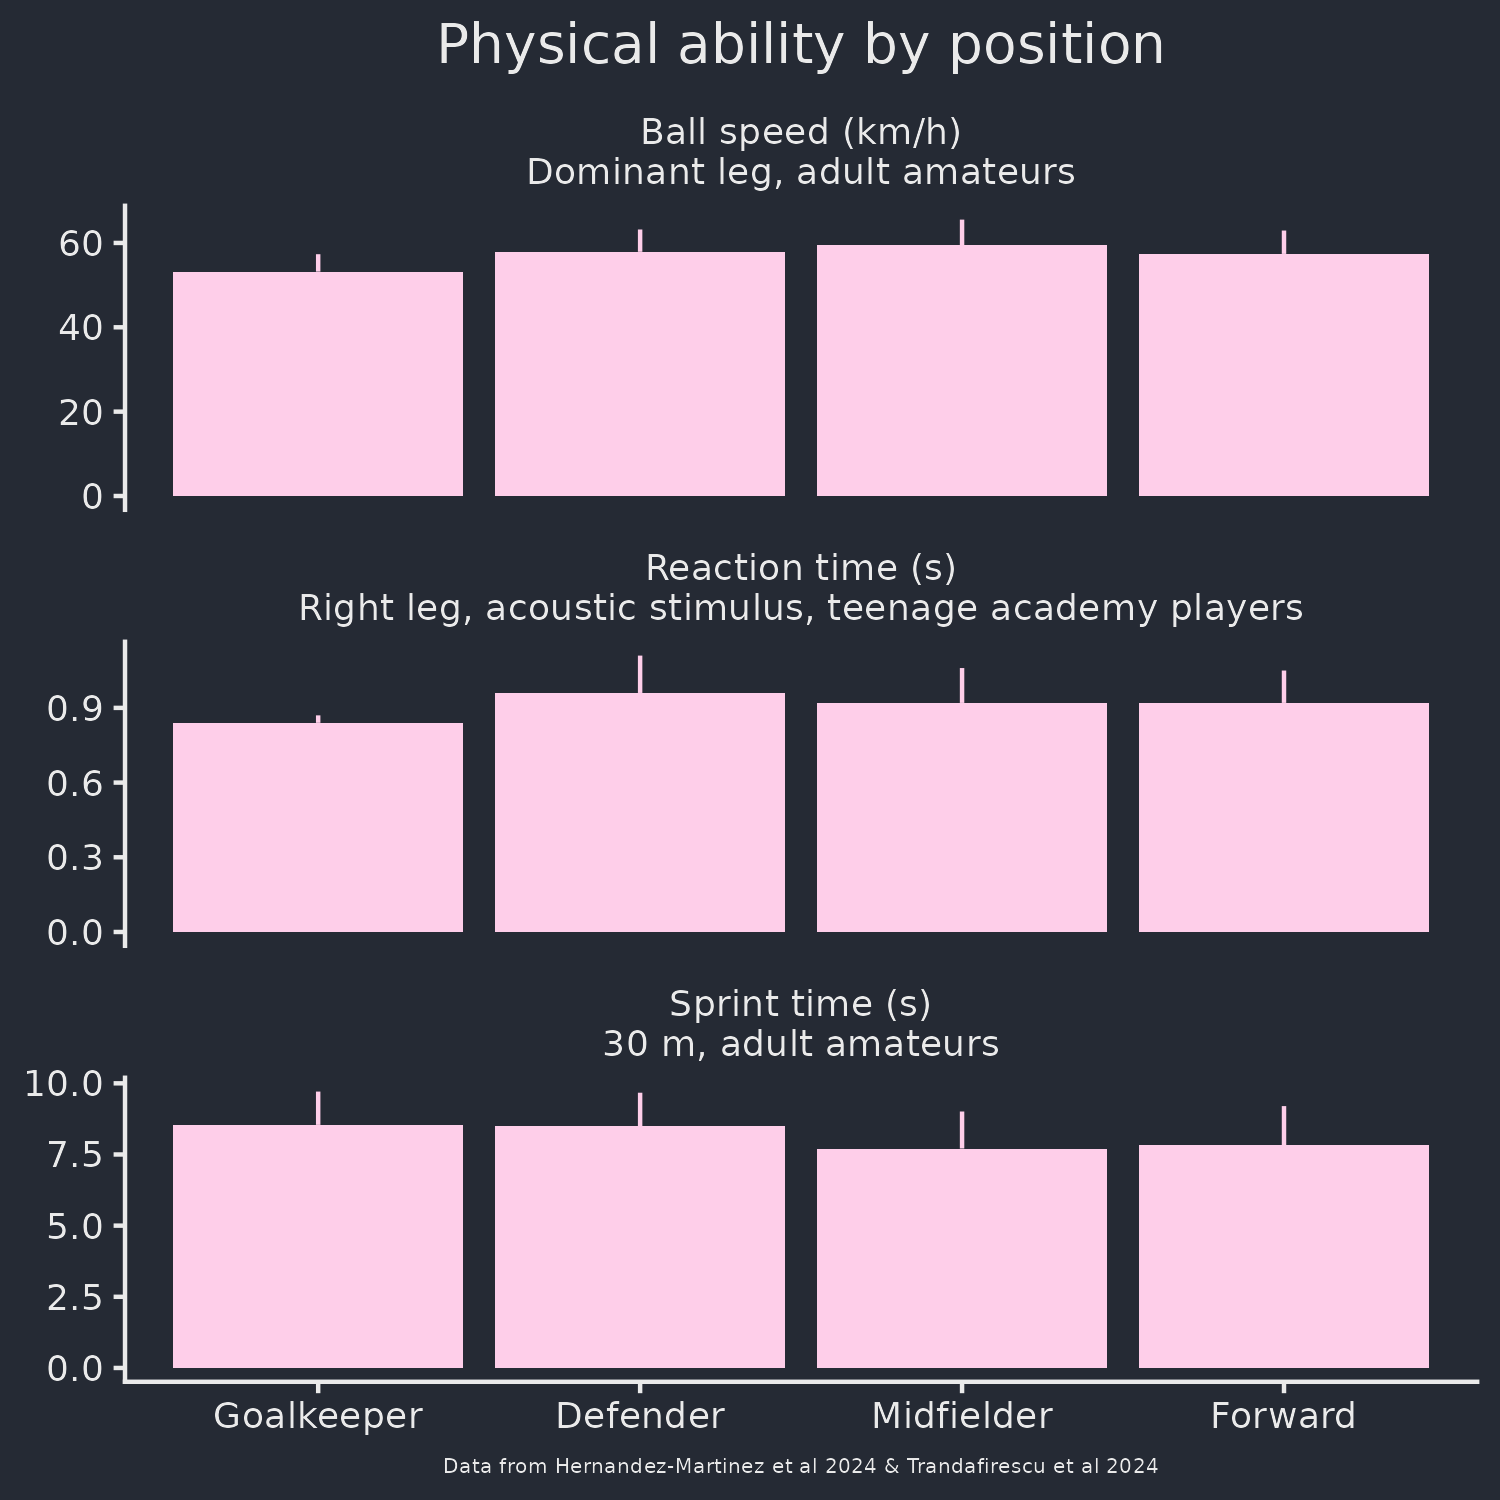
The following graph shows the relationship between game position and three physical or physiological abilities: speed at which players can kick the ball, reaction time upon hearing a sound, and the time to sprint 30 metres.
At least among the players sampled in these studies, goalkeepers have a softer kick and a slower sprint time than the outfielders. But goalkeepers do have a faster reaction time!
Blog
If you enjoyed these data visualizations, you might like to check out these blog articles on my personal site:
- The economics of taking the ball to the corner flag — equations on time wasting
- What are we doing when we play (and watch) sport? — the philosophy of football
- Soccer, the offside rule, and generational amnesia — why moving the offside line forward won’t solve any problems
- Athletes and mental health challenges
- Unique soccer matches from history